We find out too late
By the time the monthly report shows the problem, it has been a problem for three weeks.
I set up KPI tracking and alerts that watch the numbers you care about and send a message to email, Teams or Slack as soon as one moves past a limit you choose. Cash under a floor, margin below target, a large customer gone quiet or a data feed that stopped overnight: you find out that day, with enough context to act on it.
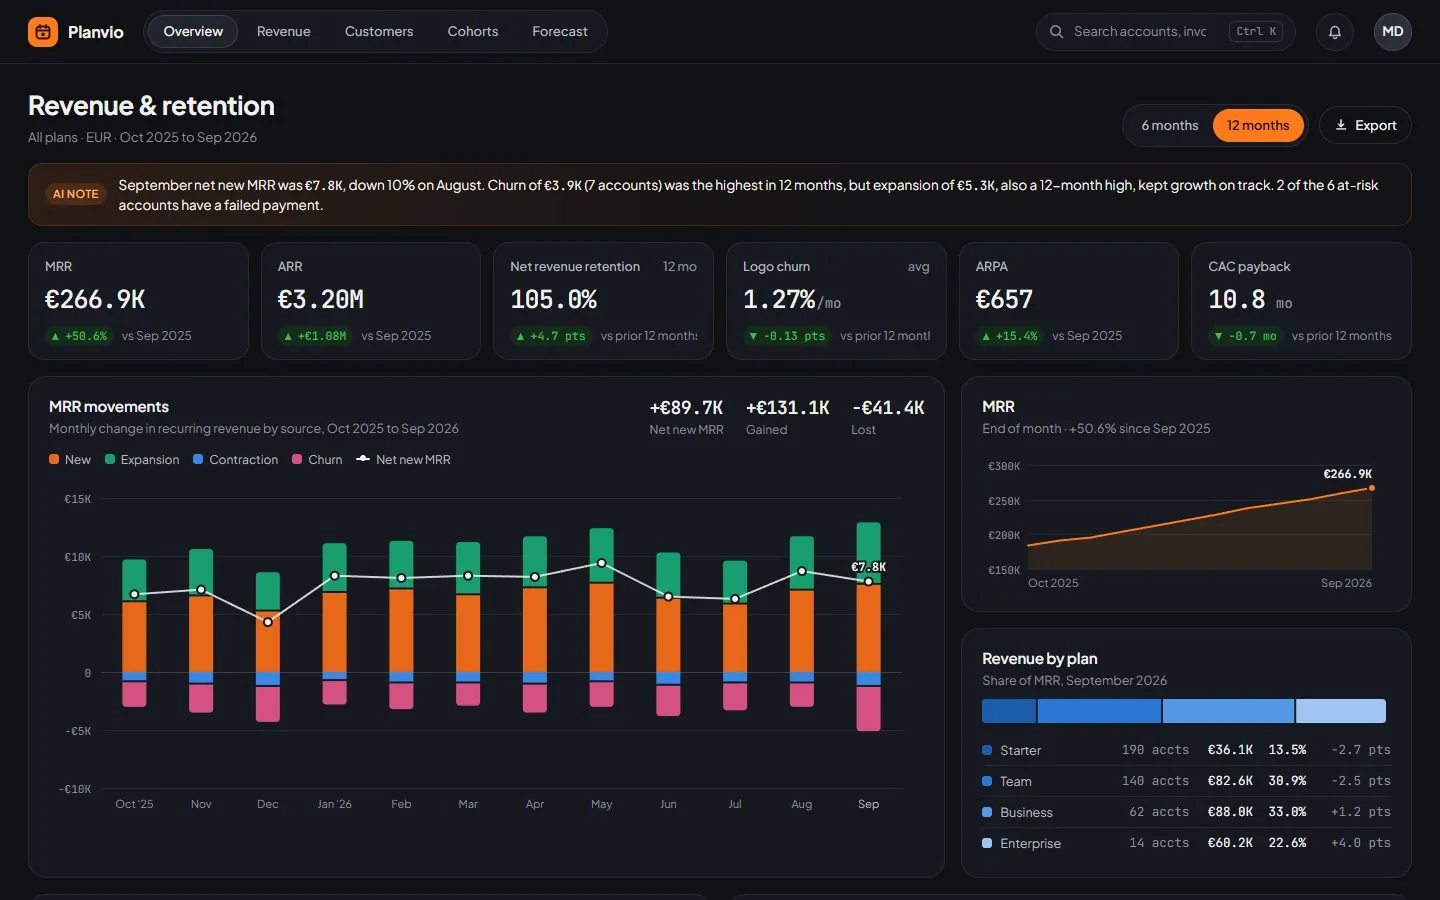 A concept dashboard for a fictional B2B SaaS company on sample data, with MRR movements and an accounts-at-risk list, the kind of view an alert links back to.
By the time the monthly report shows the problem, it has been a problem for three weeks.
We paid for a dashboard and people look at it twice a quarter. The warning signs were on it the whole time.
The refresh failed on a Tuesday and we made decisions on stale numbers until someone asked why sales looked flat.
A starting point, never a fixed package: describe how you want it and I build it to match.
Most KPI tracking fails for a dull reason: too many alerts, sent to everyone, about numbers nobody owns. After a fortnight people mute the channel. I start from the opposite end and keep the list short, give every alert one named owner and write the message so the owner knows what to check first.
The other half is trust. An alert on a stale number is worse than no alert, because it fires late or not at all. So every setup I build includes checks on the data itself (did the refresh run, are rows missing, do totals still match the ledger) and those go to whoever maintains the data, which is me if you're on the Care plan.
Power BI already has data alerts. In the Power BI service you can set one on a card, KPI or gauge tile on a dashboard, and it notifies you when that value goes above or below a number. That is fine for one person watching one figure. It gets awkward when the alert should go to a team, compare against last year rather than a fixed value, combine two measures, or post into a Teams channel with an explanation attached.
For those cases I either extend Power BI with Power Automate or Fabric Activator, or run the rules outside Power BI on a small scheduled job that reads the same model. Which route fits depends on your licences and where the data lives; I'll tell you which one I'd use and why in the quote.
A KPI tracking template in Excel, or a KPI tracking software subscription, is fine when your numbers are simple and already sit in one place. It gets harder when the figures come from three systems, your definition of margin is particular to your business, or you want a warning instead of another screen to check. Then a small build on your own data can cost less over time than another per-user tool, and if a tool would serve you better I'll tell you. For data anomaly detection I start with simple rules, such as a value far outside its usual range for that weekday, before trying anything statistical.
We choose the five or six KPIs that would change a decision this week, and leave the rest on the dashboard.
I turn each one into a precise rule with a threshold, a comparison and an owner, and you approve the list.
Before going live I replay the rules against past data, so you see how often each would have fired and adjust.
Alerts switch on and I adjust thresholds after the first weeks of real use. The Care plan keeps them current.
The price depends on how many sources and rules are involved and where messages go; a handful of rules on an existing Power BI model is a small job, while alerts across several systems take longer.
The client reviews on this site are about data and dashboard work. For this service, here is work you can open and judge yourself, each labelled for what it is.
A monthly pack for a made-up retailer, showing the layout, the data checks and the summary style. On that page the summary is generated in your browser from the sample numbers, not by a live AI model.
Open the exampleA stock analysis platform I designed, built and run myself: the interface, the web app and the data pipelines behind it, with scheduled refreshes.
Live dashboards for fictional companies, built by me on sample data to show what a finished build looks and feels like.
Browse the examplesAnything else? Ask me directly, I reply within a few hours on working days.
KPI tracking means measuring a small set of business numbers against a target or an earlier period on a fixed schedule, so you see early when one drifts. In the version I build, the right person also gets a message when a number crosses a limit, such as cash dropping under a floor, with the value, the limit and a link to the detail. Nobody has to remember to open a dashboard.
No, it is a custom build on your own data instead of another software subscription. If you already run Power BI, I usually build on that model so the alerts and the dashboard share one definition per KPI. Without Power BI, a scheduled job reads straight from your accounting package, CRM, shop platform or database and sends the same messages. You only pay for licences you already have.
Yes, Power BI can send data alerts, but the built-in version is limited. In the Power BI service you set alerts on dashboard tiles such as cards, KPIs and gauges, and Power BI emails you when the value passes a threshold. For team alerts, comparisons against targets or last year, Teams channel posts or several conditions combined, I add Power Automate, Fabric Activator or a small scheduled job on the same model.
Yes, basic data anomaly detection is part of most setups. Besides fixed limits, a rule can compare a value with its own history, for example orders far below the usual level for that weekday, or a cost line that jumps against the last six months. I start with these simple checks you can explain to anyone, test them on past data, and only add statistical models where the simple rules miss real problems.
I keep the number of alerts small and give each one a single owner. We start with five or six KPIs that would change a decision, I test the rules against past data to see how often they would have fired, and I add cooldowns so the same issue does not repeat every hour. Lower-priority signals can go into one daily digest instead of separate messages.
Yes, the alerts are built to your rules, in your channels and your wording. Describe in plain language what you want to be warned about and who should hear it, and I turn that into exact rules and match it as closely as your data allows. If something you ask for is not measurable yet, I say so and suggest the nearest thing that is.
You get a separate data health alert, so a broken feed does not hide behind silent KPI alerts. Every setup checks whether sources refreshed, whether row counts look normal and whether totals still reconcile. Those messages go to whoever maintains the data. On the Care plan that is me, and I fix the cause rather than only passing on the warning.
KPI tracking and alerts are priced as a custom quote because the work depends on your setup. A few rules on an existing Power BI model is a small, quick job; alerts across several systems with AI explanations and data health checks take more. I send a fixed price after seeing which numbers you want to watch, and alerts are often added to an automated reporting or dashboard project.
I build automated reporting that puts your monthly or weekly pack together on its own: figures pulled from your systems, checked, charted and sent with a short commentary drafted by AI.
from €1,500 · Learn more Data & dashboardsCustom data dashboards, live on your own data and APIsI build custom data dashboards that pull straight from the tools your business already runs on, so the numbers refresh on their own instead of in someone's spreadsheet.
from €600 · Learn more Care planThe Care plan: website maintenance plans and analytics managed servicesThe Care plan is how I offer website maintenance plans and analytics managed services to B2B clients: one monthly fee that keeps your website, dashboards and automations correct after launch.
Quoted with your project · Learn more