The same deck every month
The layout never changes, only the numbers do. Someone still spends hours copying them in and hoping none of them are wrong.
I build automated reporting that puts your monthly or weekly pack together on its own: figures pulled from your systems, checked, charted and sent with a short commentary drafted by AI. You read the draft, add what only you know, and approve it. Describe the report you make by hand today and I build the automated version of that report, in your layout.
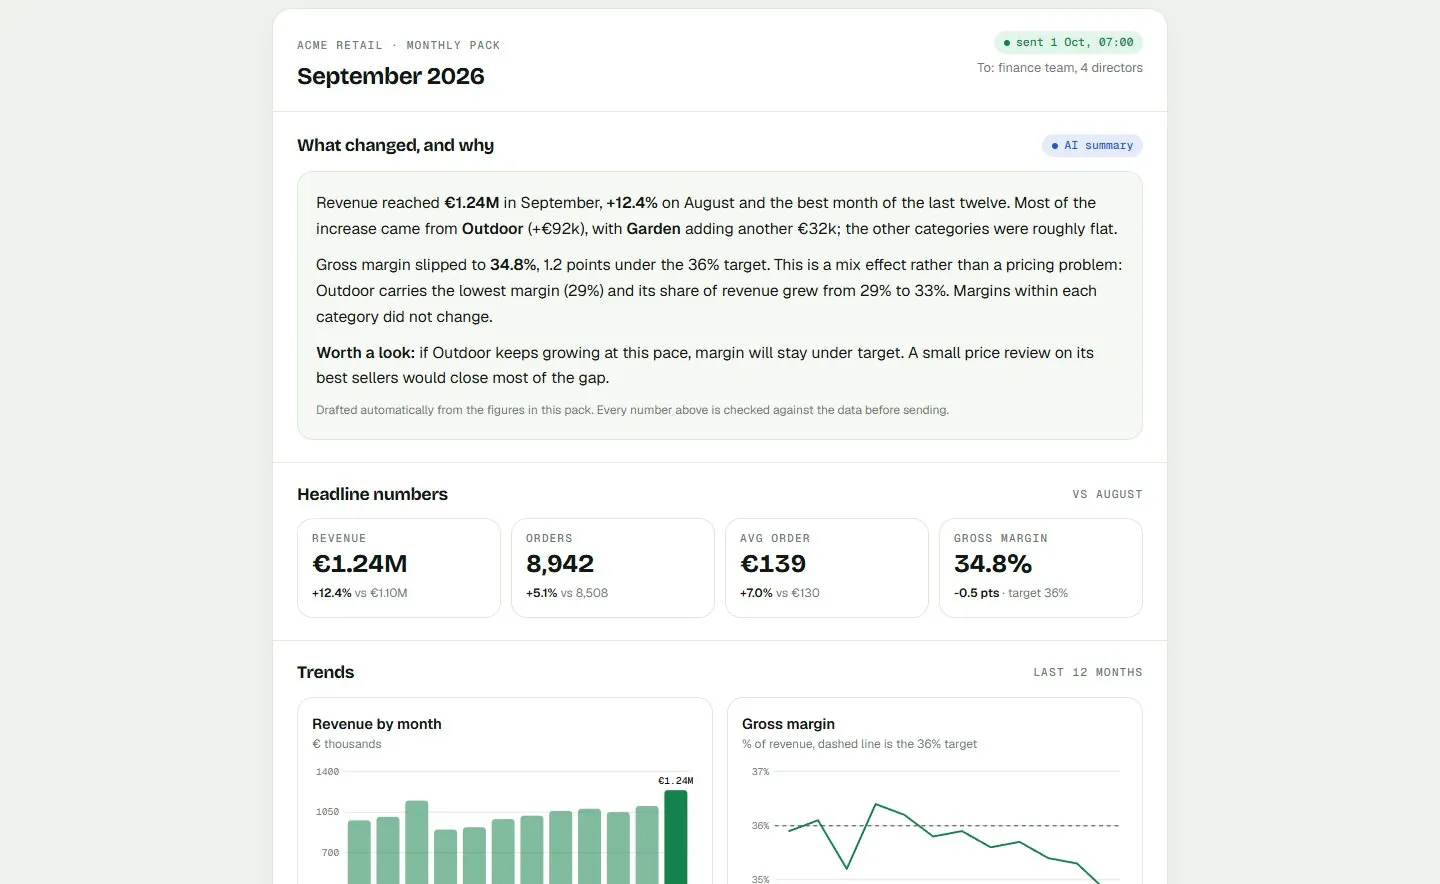 A full monthly pack for Acme Retail, a made-up company on sample data, with the AI summary, headline KPIs, 12-month trends, a category table and the data checks that run before sending.
The layout never changes, only the numbers do. Someone still spends hours copying them in and hoping none of them are wrong.
Every month I write the same "what changed and why" for the directors, and it is always the last thing done before the deadline.
We automated part of it once. It failed without telling anyone and the wrong numbers went out.
A starting point, never a fixed package: describe how you want it and I build it to match.
The rule I build on is simple: numbers come from the data model and the AI only describes them. The model receives the figures that were already calculated, such as revenue, margin and the change per category, and writes sentences about those. Before the email leaves, a check compares every number in the text with the data. A sentence that does not match is held back and flagged for you.
For automated financial reporting, most of the time saved sits between the books closing and the pack reaching the board. Once the ledger is final, the pack rebuilds as soon as the sources refresh, so the controller spends the morning reviewing a draft instead of rebuilding charts.
If your reports already live in Power BI, much of the plumbing exists. Scheduled refresh keeps the model current and subscriptions can email a report on a timetable. What Power BI won't do by itself is check that every source actually refreshed before the email goes out, write the commentary, or hold the send when a total stops matching the ledger.
So I keep your semantic model as the single source and add the missing steps around it, with Power Automate or a small scheduled job that queries the same model. The report and the dashboard then share one definition per KPI, and nobody has to keep a second set of numbers in Excel.
AI is good at describing movements in numbers it is given: which category drove growth, whether margin fell because of pricing or because the sales mix shifted, which KPI crossed its target. It has no way of knowing about the one-off contract, the supplier dispute or the price increase you agreed last week. So the draft goes to a named person who adds that context and approves it. That review is usually short, because the facts are already in place and checked.
The same setup covers automated client reporting, where a consultancy or marketing firm sends every client the same monthly report with that client's own numbers. Only aggregated figures go to the model, never customer-level rows. I'm based in the Netherlands, use EU regions where the provider offers them, and sign an NDA and DPA on request. I work async, so a brief sent at the end of a US working day usually has progress waiting the next morning.
Send last month's pack and a note on what bothers you about it. I sign an NDA first if you need one.
I trace each figure back to its source and reply with a fixed price, a delivery date and any data gaps I found.
I build the automated pack and we run it next to your manual version for one cycle, so you can compare every number.
After your sign-off it runs by itself. The Care plan keeps it correct when a source or a KPI changes.
The setup price covers one recurring pack from a small number of sources; more sources, more pages or an approval workflow move it up, and I fix the price before any work starts.
The client reviews on this site are about data and dashboard work. For this service, here is work you can open and judge yourself, each labelled for what it is.
A monthly pack for a made-up retailer, showing the layout, the data checks and the summary style. On that page the summary is generated in your browser from the sample numbers, not by a live AI model.
Open the exampleA stock analysis platform I designed, built and run myself: the interface, the web app and the data pipelines behind it, with scheduled refreshes.
Live dashboards for fictional companies, built by me on sample data to show what a finished build looks and feels like.
Browse the examplesAnything else? Ask me directly, I reply within a few hours on working days.
Automated reporting means your recurring report is built by software on a schedule instead of by a person copying numbers into a deck. The data is pulled from your systems, checked, calculated and laid out the same way every time, then sent to the people who need it. In the version I build, an AI model also drafts the written summary from the calculated figures, and a person approves it before it goes out.
Automated reporting starts from €1,500 for the setup of one recurring pack. The final price depends on how many sources need connecting, how many pages the pack has and whether you want an approval step before sending. You get a fixed quote before work starts. Keeping it running afterwards is optional through the Care plan, which is quoted together with the project.
I start by tracing where every number in the current report comes from. Then the sources are connected to one model, each KPI gets a written definition, the layout is rebuilt to match what your readers already know, and data checks are added before sending. The automated version runs next to your manual one for one cycle, so you can compare every figure before switching over.
Yes, and that is often the quickest route to automated reporting, because the model and the measures already exist. I keep your semantic model as the source, set up the refresh and the delivery schedule, add data checks before each send and, if you want it, an AI-drafted summary of the period. Before quoting, I check whether your current Power BI licences cover the delivery you have in mind.
Yes, the service is a starting point and the pack is built to your brief. Tell me in your own words what the report should show, who reads it, how it should look and where it should arrive, and I match that as closely as the data allows. If you already have a deck or spreadsheet your directors like, I usually copy its layout so nobody has to relearn anything.
No, because the AI never calculates anything. All figures come from the data model, the AI only writes sentences about numbers it is handed, and a check compares every number in the draft with the data before sending. If a figure in the text does not match, that line is flagged instead of sent. You also approve the commentary yourself, so nothing reaches the board without a person reading it first.
The setup is built to send the model as little as possible: only aggregated figures, never customer-level or personal data. I'm based in the Netherlands, use EU regions where the provider offers them and choose API terms that exclude training on your data where that option exists. NDA and DPA on request. If you prefer, the whole thing can run inside your own Microsoft tenant.
No, Power BI is one option and not a requirement. If you already have a Power BI model I build on it, because then the report and the dashboard share one definition per KPI. Without it, the pack can read directly from your accounting package, a database or exported files and arrive as an email, a PDF or a web page, with no per-user licence needed.
I set up KPI tracking and alerts that watch the numbers you care about and send a message to email, Teams or Slack as soon as one moves past a limit you choose.
Custom quote · Learn more Data & dashboardsPower BI consulting services from one certified specialistMy Power BI consulting services cover the whole job for B2B teams in the US and Europe: the data model, the DAX, the report design and the handover.
from €300 · Learn more Care planThe Care plan: website maintenance plans and analytics managed servicesThe Care plan is how I offer website maintenance plans and analytics managed services to B2B clients: one monthly fee that keeps your website, dashboards and automations correct after launch.
Quoted with your project · Learn more