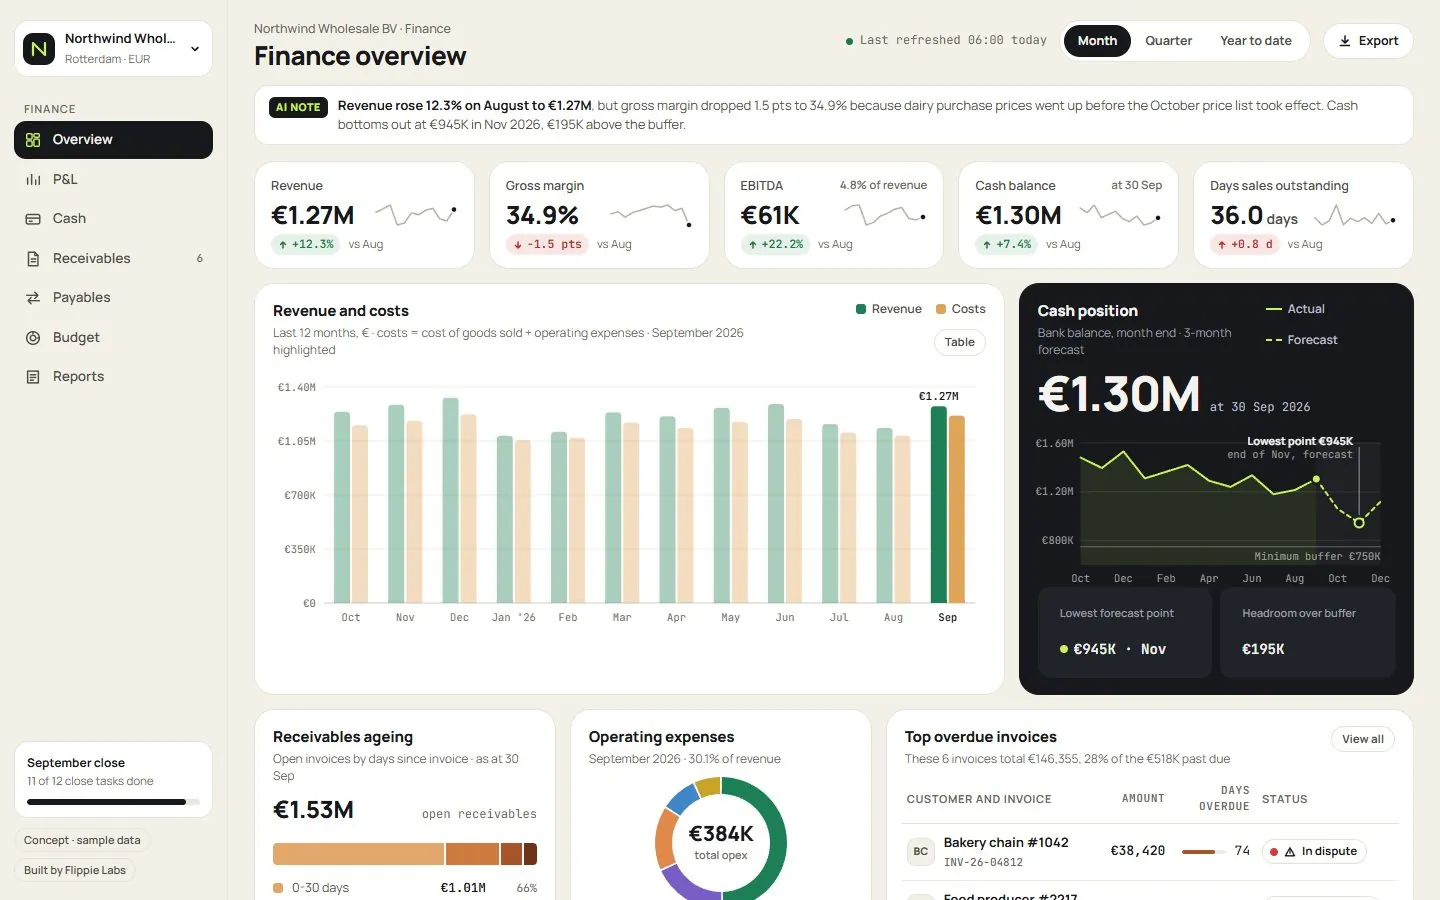
 Finance
CFO dashboard
Northwind Wholesale · for CFOs and finance leadsRevenue, margin, EBITDA and cash in one place, a 3-month cash forecast, receivables ageing and the overdue invoices that need a call.
Six working KPI dashboards, each built for a different team and a different question. Open them, switch the periods, hover the charts. Every one can be built for your own data, as a web dashboard, inside a client portal, or in Power BI.
Finance
Revenue, margin, EBITDA and cash in one place, a 3-month cash forecast, receivables ageing and the overdue invoices that need a call.
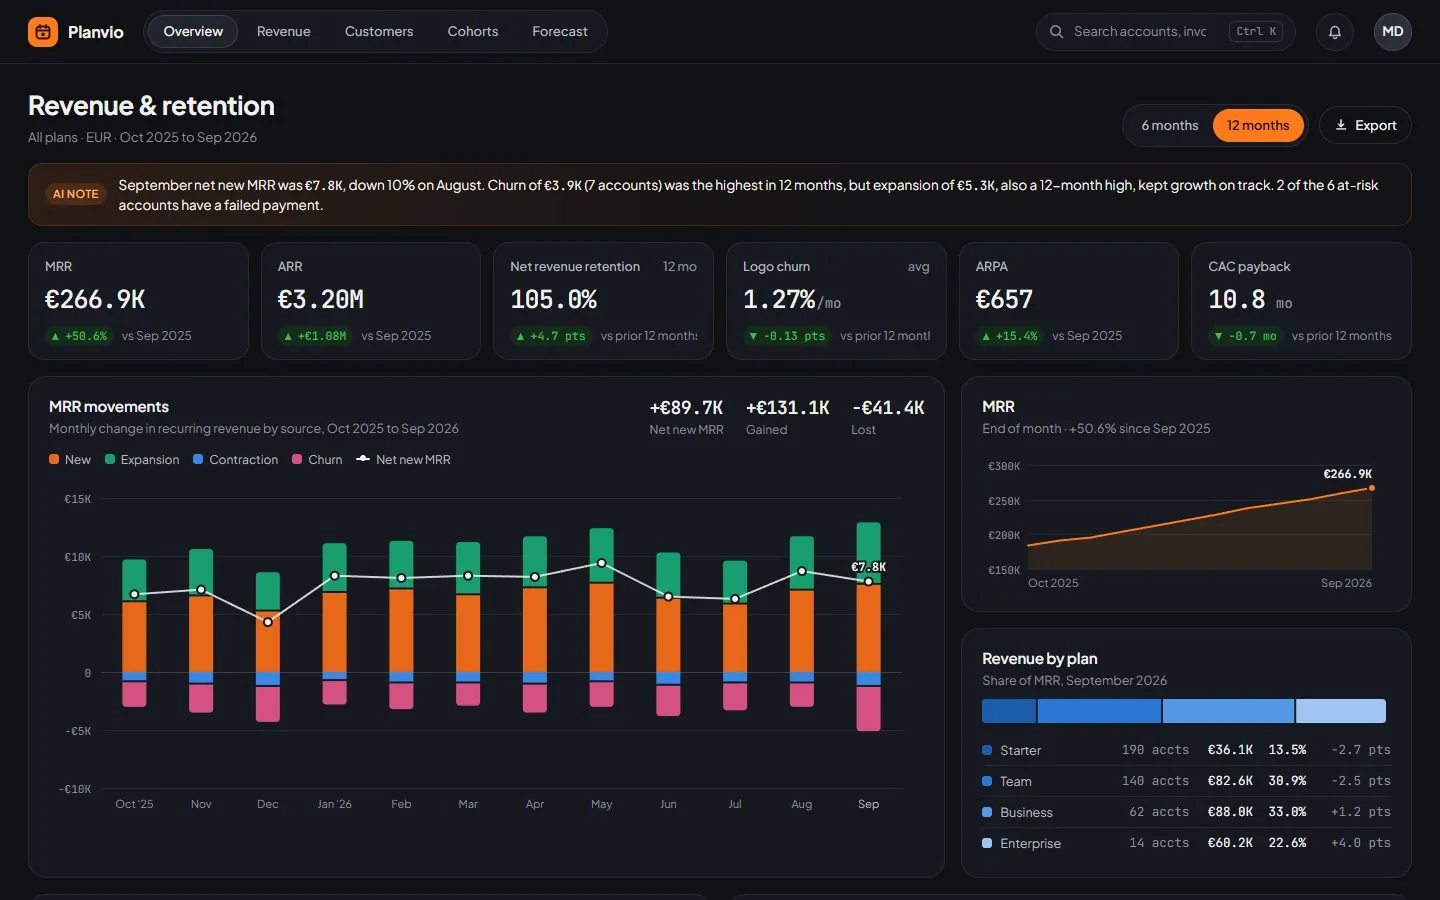 SaaS
SaaS
MRR movements split into new, expansion, contraction and churn, cohort retention, plan mix and the accounts most likely to churn.
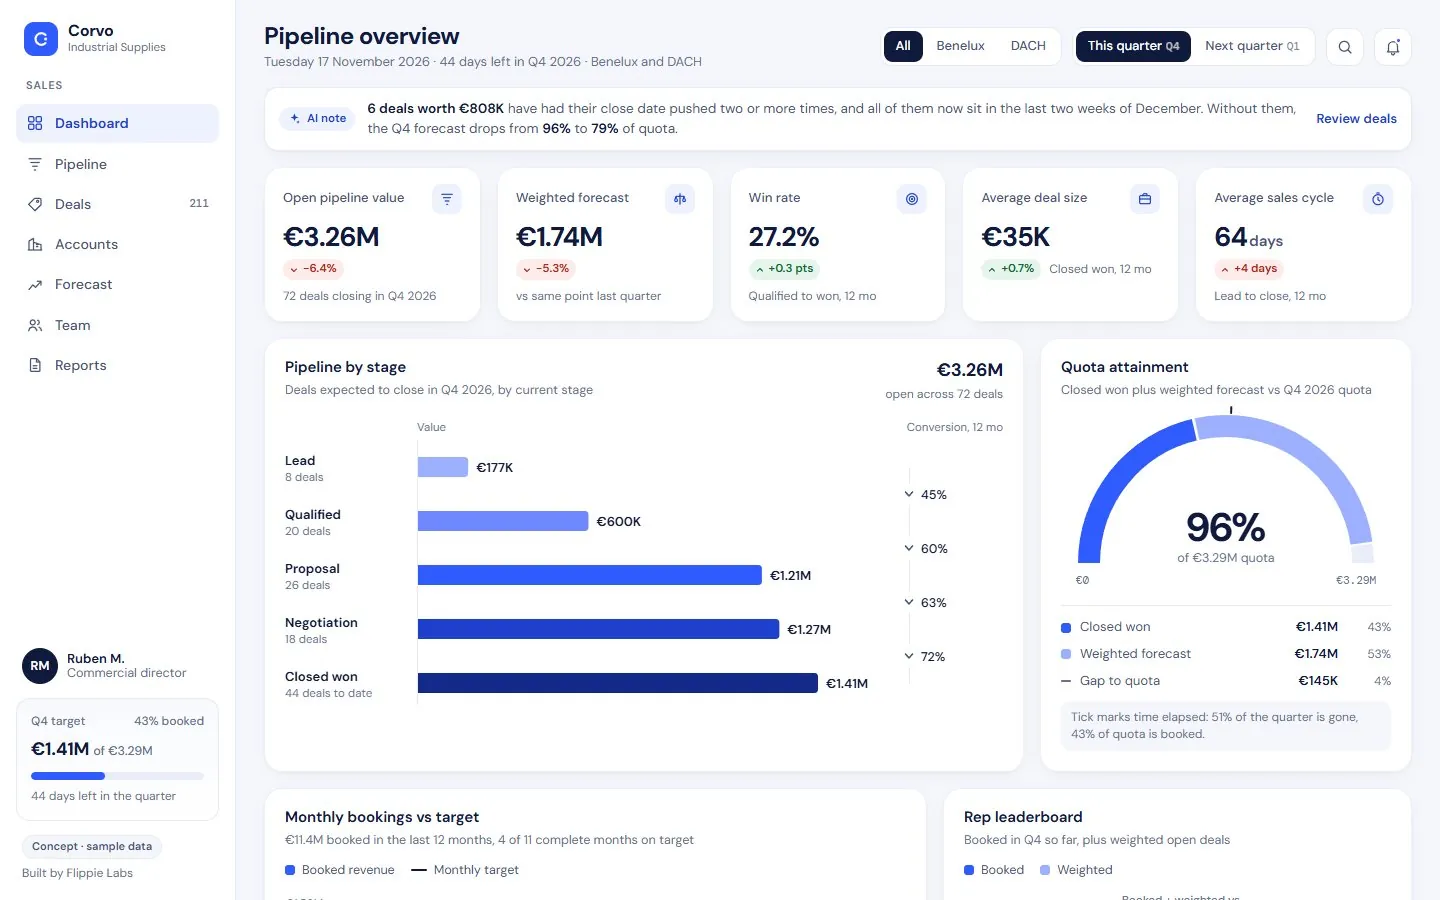 Sales
Sales
Pipeline by stage with conversion, weighted forecast against quota, bookings against target and a rep leaderboard, by region.
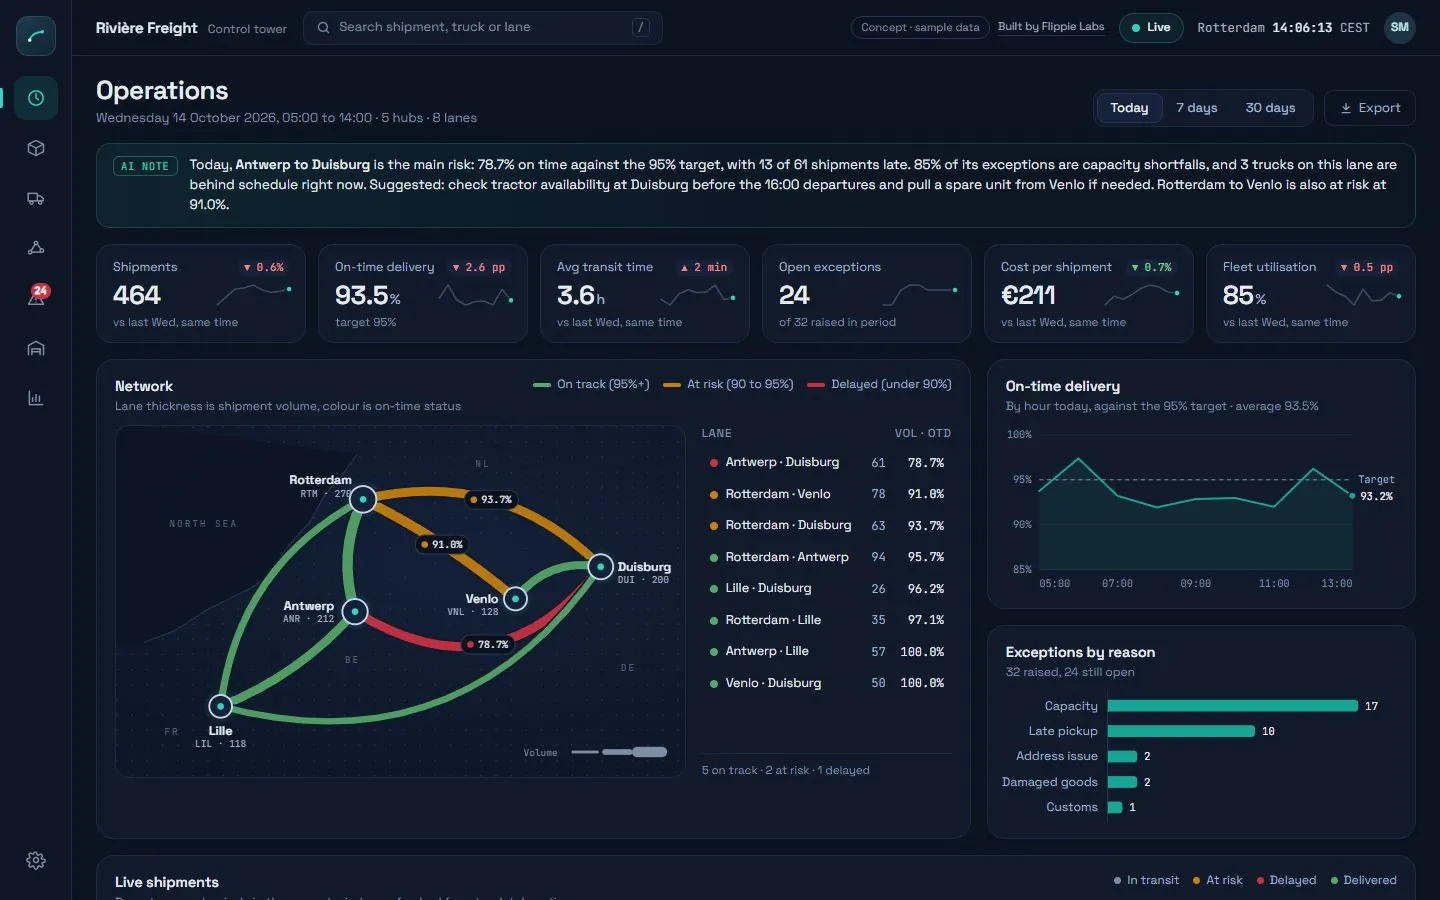 Logistics
A live network map of lanes between hubs, on-time delivery against target, exceptions by reason and every shipment at risk.
 E-commerce
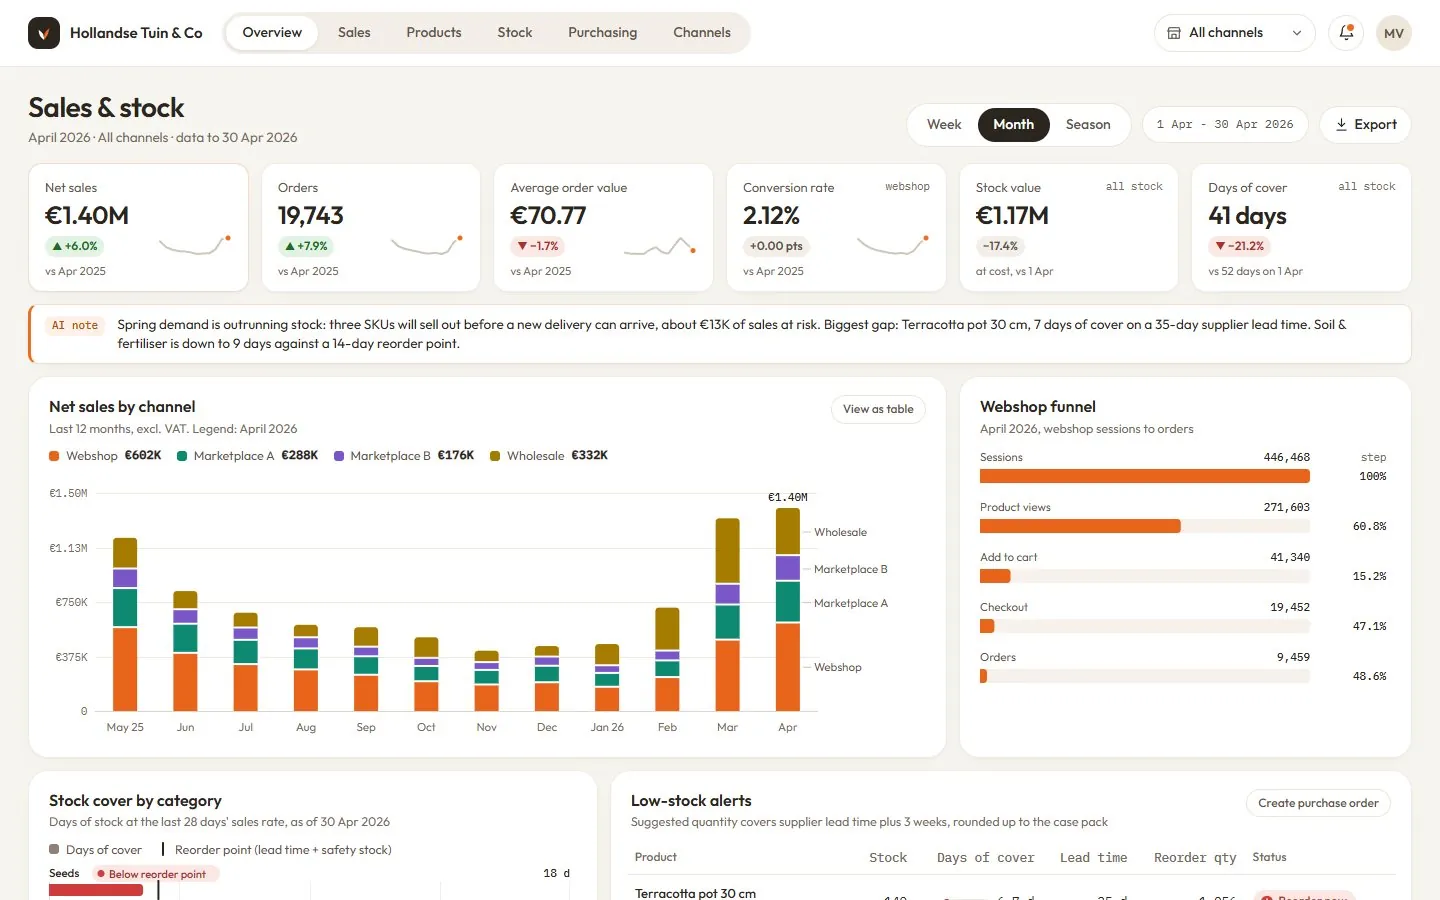
Sales by channel, the webshop funnel, days of stock cover per category and a reorder list that tells purchasing what to buy this week.
 Agency
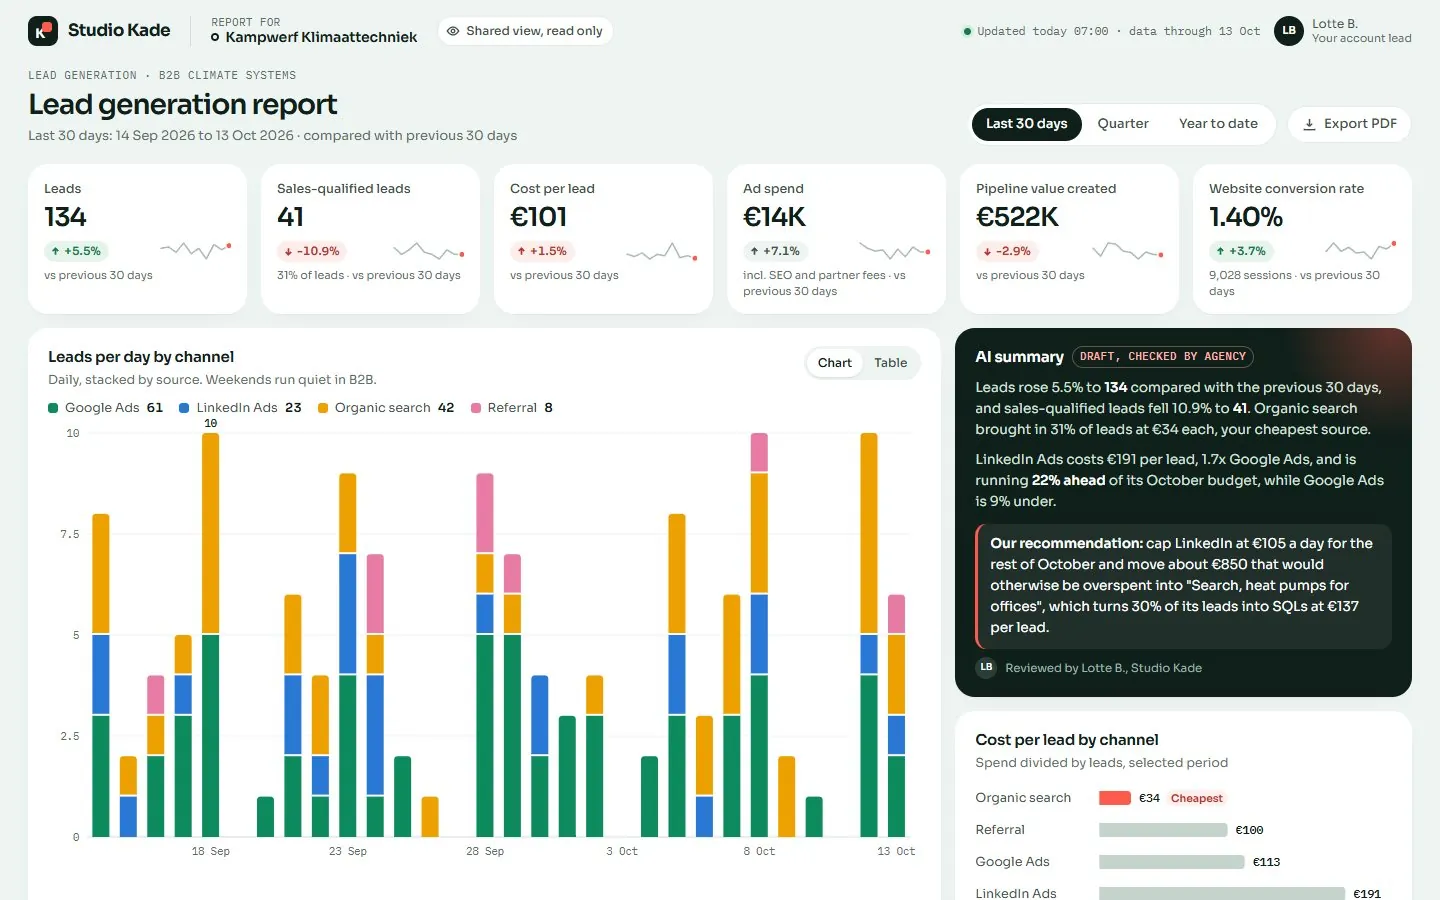
A live, read-only client portal instead of a monthly PDF: leads by channel, budget pacing, cost per lead and campaign status.
Each example is a real pattern: the data model, the KPI definitions and the layout are the hard part, and they carry over to your business.
Live dashboards from €600, Power BI from €300. Fixed quote, EU-based, GDPR-ready.